
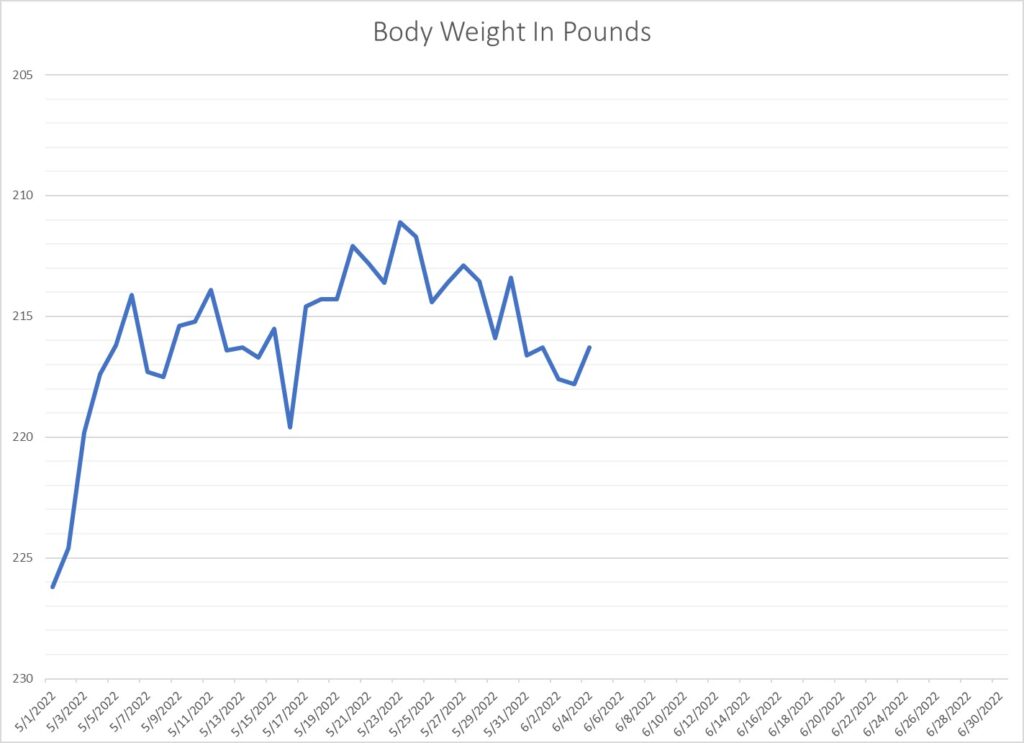
Body Weight Graph Show Stabilization of Weight
As I have mentioned before, when one starts a new Diet/Exercise Program, our bodies undergo a “remodeling,” and the weight comes off quickly at first, then stabilizes. At first, it dropped dramatically, then stabilized in the 216-217 range. The low was 211. See the graph below; it would be easy to say at this point that my “weight” is coming back. But the leveling out is genuinely happening, and this is an accurate “weight.” But weight loss isn’t what I am looking for in these first 6-8 weeks but FAT LOSS. If we move down to the following graph, we will see my “lean Tissue” graph.
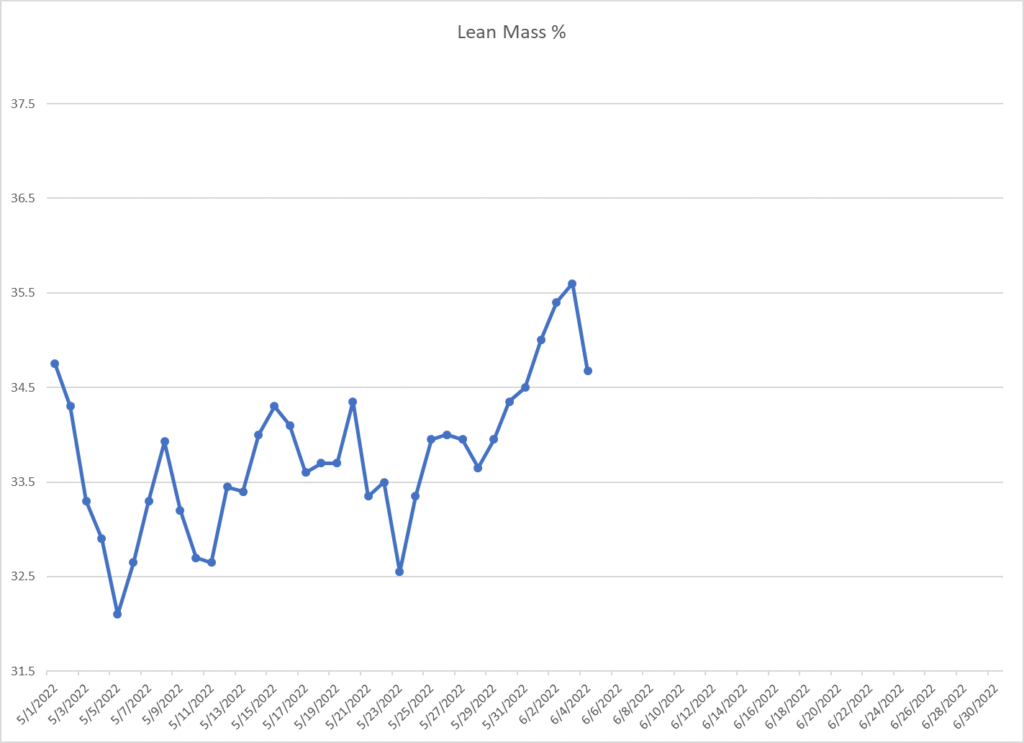
Lean Mass Graph
Look below, and you will see a graph that dropped quickly in the beginning but has risen, on average, over the last 30 days. If you draw a line from the lowest point to the average of the higher numbers, we have a rising graph that equates to Lean Muscle maintenance. Starting around 34.5% and at that point now. Remember that there can be a daily variance of 1-2% on any day, but the TREND matters. On this graph, at this point, I have maintained my lean muscle while losing overall weight. On most diets, one loses 40-50% of the weight in muscle tissue. On this diet, at this point, I have maintained my muscle which is at odds with most studies on weight loss. How was I able to lose weight AND maintain muscle? I believe four factors played into this.
The Points To Follow
- I ignored what looked like bad numbers on THIS graph because my weight was going down, and I knew this graph would stabilize.
- I ate plenty of protein. Both studies and anecdotal data say one should eat 1 gram per pound of body weight. For me, that was 200 plus grams a day. This is a lot, and at times it wasn’t easy. But I ate it.
- I limited my calorie deficit to about 500 calories a day. More would have lowered my metabolism.
- I did High-Intensity Resistance Training twice a week for twenty minutes. That was my total exercise, but because it was intense (one set to temporary muscle failure), it helps maintain muscle and increases metabolism.
- I tracked my weight, lean tissue and body fat daily but ONLY watched the trends, not the daily variations.
- I checked my metabolism every week to ensure it was not slowing down. The ONLY way to do this is with a breath metabolism test (Pnoe). My metabolism remained the same throughout.
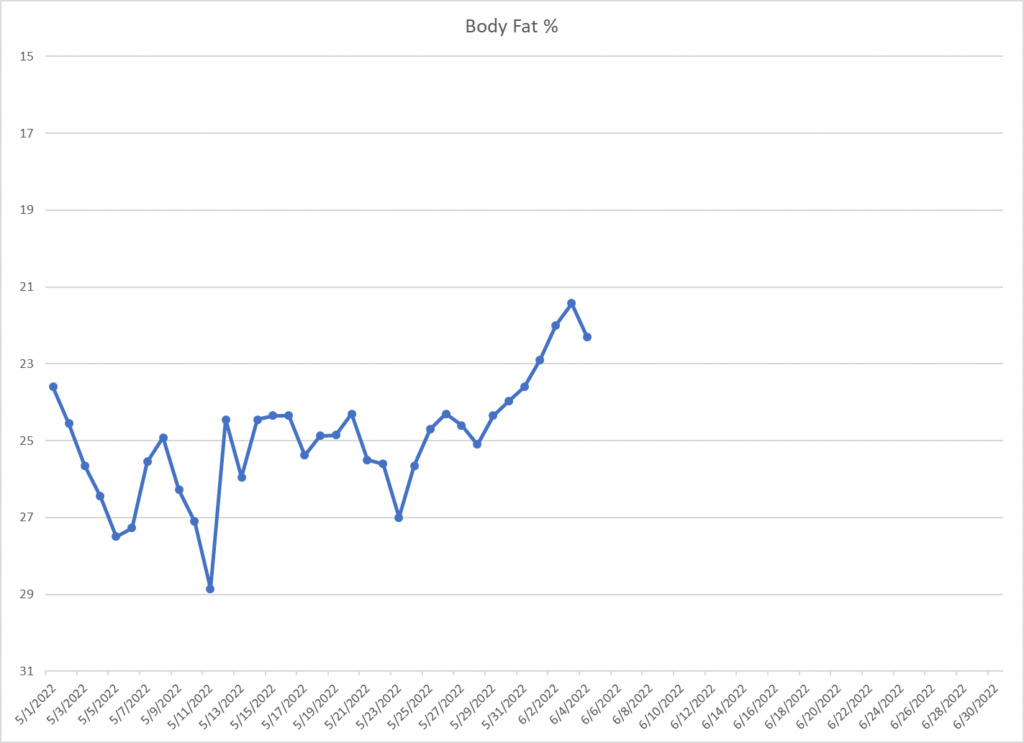
The Graph I Was Waiting For: Body Fat Percentage
In the beginning, because of “remodeling,” my body fat percentage went up (down on the graph). But over time my body fat slowly went down (up on the graph). My fat started around 23.5 and after 5 weeks it is lower at approximately. 22%. That doesn’t sound like much but if we look at the average it is roughly 25.5 and now it is 22. 3.5 pounds over 6 weeks is .6 pounds a week. I would have liked a little more but I am OK with it as I intend to continue. I am actually quite pleased because my body fat % was near 30% just a couple of years ago. I slowly lost weight but plateaued at 220. Now it is lower and stabilized.
Summary
Follow the guidelines above, be willing to stick to a calorie deficit that is reasonable and you will lose weight and keep it off.
And keeping it off is the hardest, BEST THING to do!
