Several times this year I, like many of you, have begun a weight loss program only to be derailed by myself. It is just to easy to have a cheat day and then “NOT” get right back on.
The best thing that I have found is to make the decision and start. If you “fall off” get right back on it.
When you “cheat,” people tend to eat the very worst foods and they often experience what seems like significant weight gain. But often it is just the body reacting to the food. And most of that gain is water or bloating in the gut.
So one can get discouraged and just “fall off and stay off” the diet. So an advice is make the decision, start and stay on it as long as you can. The longer the better. If you get off, get back on.
The same can go for an exercise routine. Decide to start, start and stay with it. Don’t stop for a week because you missed a day.
Often diet and exercise are started together. Because you get off one doesn’t mean you have to get off both.
I will post my success and losses. Hopefully more of the former.
Wins and Loses
Following are three graphs I am keeping on my weight loss program. I combine diet with High Intensity Resistance Training (More on this later). I started strict Keto, under 50 grams of carbohydrates a day on Saturday April 30, so the graphs start on May 1st.
Keto is explained here from WebMD but I will get into simpler explanations on further posts. A few things in this article are disagreed upon by others in the medical field.
As you can see my weight has dropped 8.9 pounds in 7 days. It was weight, though, not fat. Ir is not scientifically possible to lose that much fat unless I dont eat. But water weight CAN come off very quickly at the beginning of a Keto Diet. And I’ll explain why my weight went up tomorrow. You will see in graphs 2 and 3 that there was also a reversal. Two Good reversals.
Why Am I Doing This?
I am not doing this for “ego” but because I hope I will learn some new things about myself and maybe I can help others.
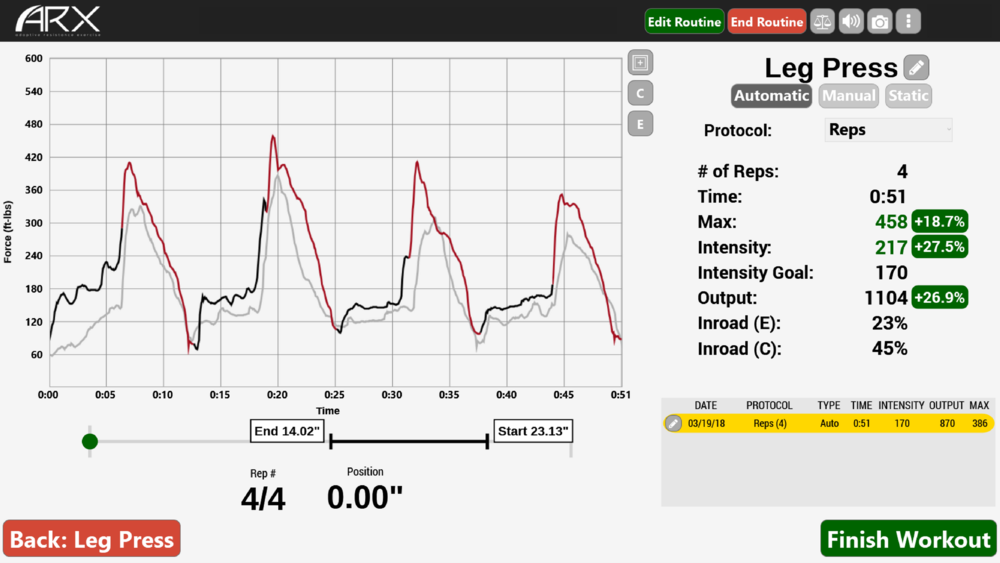
Weight loss is one of the primary reasons why we acquire new customers for Leo Fitness Lab. Gaining muscle/strength is a close second. There is a lot to learn and know in these two fields. And you need a persoanl trainer!
For today I am going to go over one of the oddities of weight loss and that is the “miraculous” amounts of “weight” than can be measured on your home scale. I use the quotations because when one goes on a drastic diet it is very possible to see dramatic changes in weight, physical weight. But not necessarily fat loss, which is what we are really after.
Weight Lose Graph
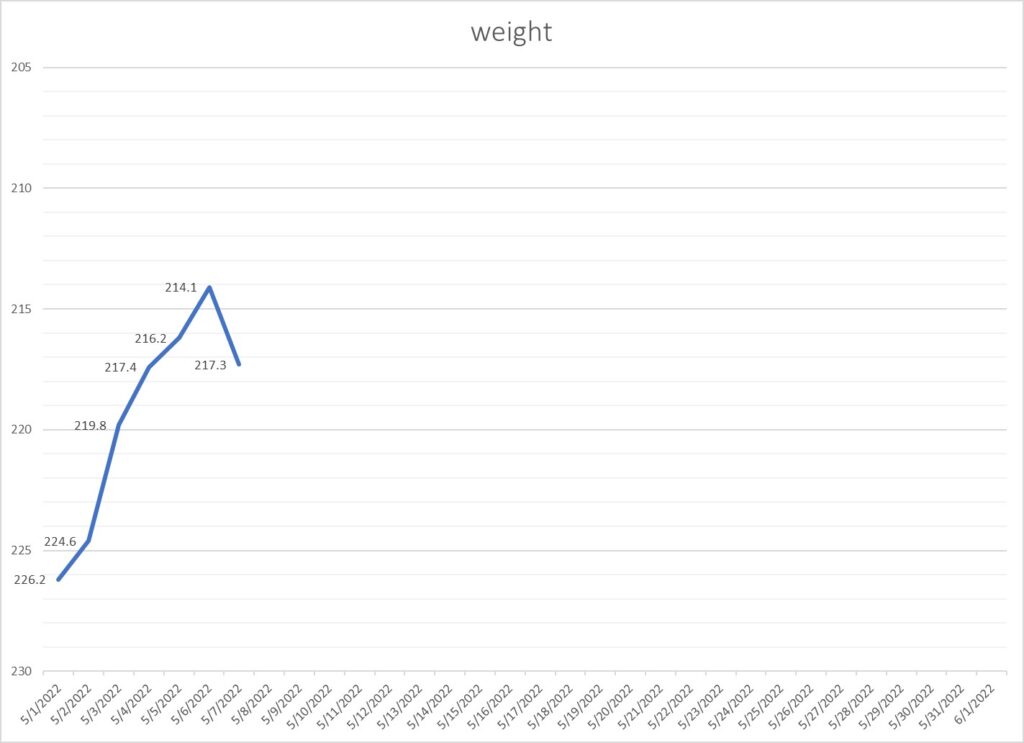
Looks good right? But it is impossible to lose x pounds of fat as fat has 3500 calories per pound and I only burn about 2800 calories a day so even if I ate nothing I could not lose this much fat. It is my body “rebalancing” according to this “new” diet.
That said, my body has been used to Low Carb Eating for some years now. I do get off this method of eating but for at least five years I have returned and my weight has come down from the 240-250 pound range to the 215-225 range.
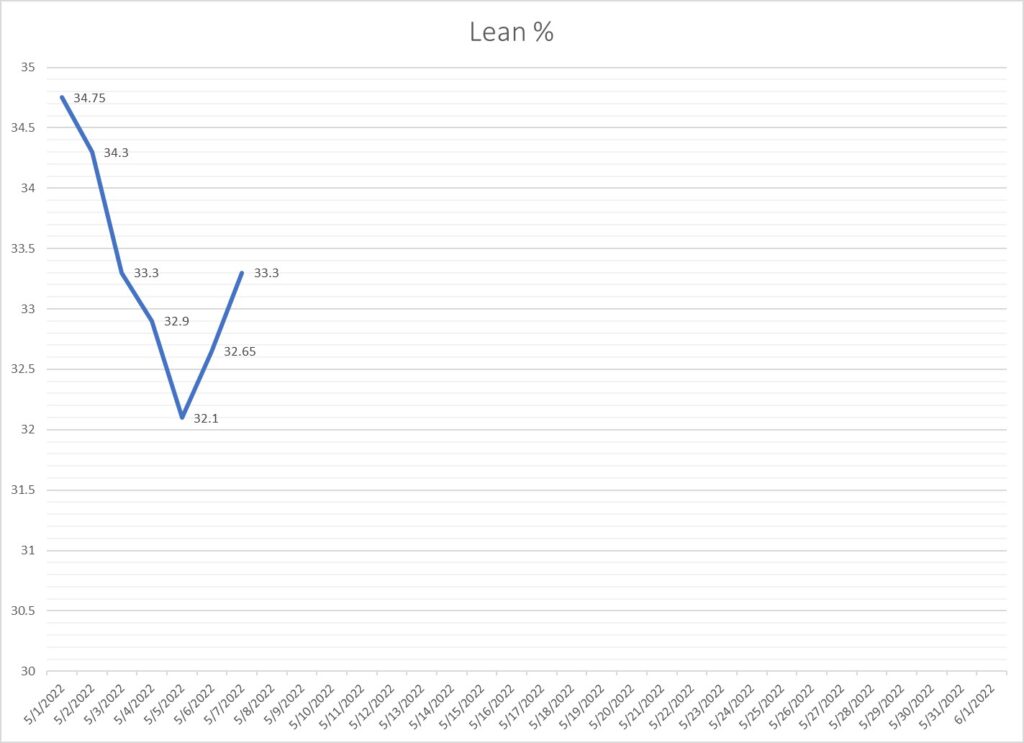
If you look at the other, sometimes more important graphs, my percentage of lean tissue (muscle, tendons and bone) they seem to be going down. This should be alarming but it isnt to me because I have seen it before. And I am eating adequate protein and doing 10-15 minutes of very HIGH Intensity Resistance Training to stimulate the muscles. I am also doing an hour of fairly strenuous PT on my lower body as I am recovering from some nerve damage in my right leg. That is a story in itself!
Lean Tissue Graph
Body Fat Percentage
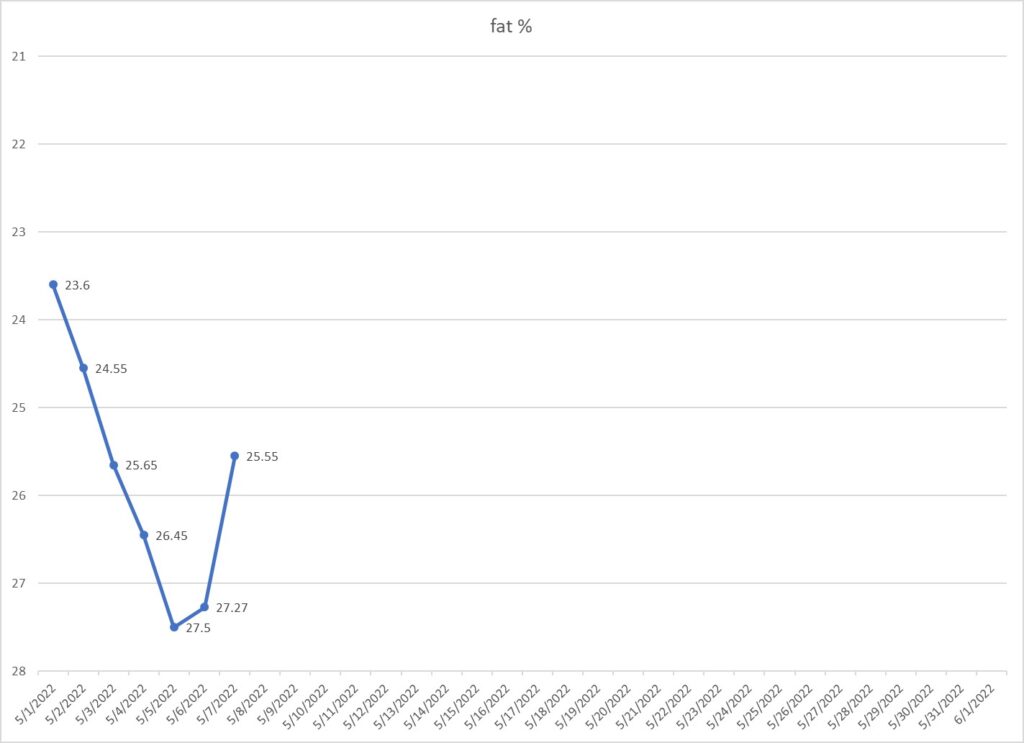
As you can see my lean tissue has gone “down” 1.45% and my body fat “up” by roughly 1.95%. Again, neither of these is possible as I am eating over 200 grams of protein and adequate calories to maintain muscle. This is just the rebalancing of fluids (water and blood) in muscle cells and the water outside of muscle cells.
I am not worried in the short term, though I may take a serious look at my calories as I have been struggling to get to 2200 a day. That should be my target as I believe my expenditure is around 2800 a day. I usually skip breakfast so it is difficult to eat 2200 calories in two meals. But I am working on it.
I will do another PNOE test on Saturday, the 5th of May. Which I did and I will write about tomorrow. To determine my BMR (Basal Metabolism Rate or the minimum calories one needs to maintain body functions daily, other than movement.) Basal means, “bottom layer or base,” Metabolism is the turning of food into body tissue, energy and waste products and Rate is the amount of “burn.”
This leads to another entire subject which is why we plateau on diets. Because our caloric needs go down. And why we gain fat back so quickly after a diet when we resume normal eating, Your body just doesn’t need as many calories as it did “pre-diet.”
I will expand on all of these subjects as the weeks go by.
Metabolism Test
After I do this next PNOE test I will be able to compare to previous tests. This will show me if my metabolism is staying at the same rate. Which is what I want. Diets, can cause a reduction in the rate you burn calories. This is a survival mechanism from the early days our ancestors were hunter-gatherers. When food was scarce the body learned to lower is caloric needs.
