
Easy ways To Graph Your Numbers
There are multiple ways to measure body composition. One of the old-time standards was to dunk a person in a body of water. This is messy and time-consuming. (definition here from Healthline.com: This method, also known as underwater weighing or hydrodensitometry. it estimates your body composition based on its density. This technique weighs you while submerged underwater after exhaling as much air as possible from your lungs.) At Leos Fitness Lab we use the scientific full body, RESEARCH GRADE body composition instrument. This device is called the Cosmed BodPod. It is a dry system and only takes about 20 minutes or less. The Bodpod has been tested against the old standard of hydrostatic testing and is equal. It is as accurate and a lot more convenient. There is also home “body composition scales” to track my health progress. They are sometimes not as consistent or absolutely accurate. But they show me I am losing body fat and gaining lean tissue over time. It is nearly impossible to be “unhealthy” if you are losing body fat and gaining muscle. (Other than a separate disease.)
Graphing It Makes IT Better
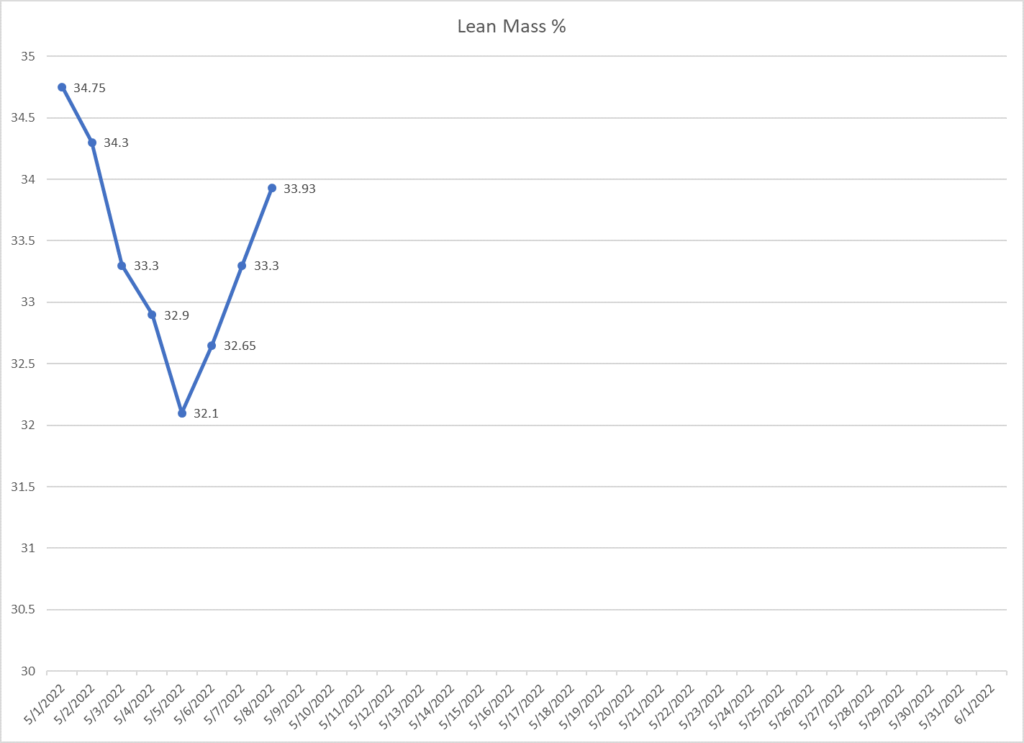
But my favorite tool, after the scales, is to visually graph my weight. I do body fat %, lean tissue % and total weight. Waist circumference should be added as well to inspire. I do this on actual paper graphs that I put on the wall of the bathroom. I weigh in and update these daily as soon as I wake up. This gives for consistency which is vital for weight loss programs. It is done at the same time of day, after using the toilet. Also before drinking any liquids or eating any foods. This creates a constant environment for the “tests” of using the body composition scale.
Some scales give you numbers of pounds of fat/muscle. Some give you the % of fat or muscle. Either work well. I sometimes graph each scale separately but have also averaged all the numbers and keep fewer graphs. The choice is yours.
If total weight is going down, and bod fat percentage is also decreasing, then you know you are losing fat, not muscle. This is the ideal situation. But you can have situations where you can only do one or the other. Lose body fat OR gain muscle. Both lead to improved health and fitness.
Since these scales are not scientific instruments, there will be some inconsistency from ONE DAY TO THE NEXT. Overall, week to week, they will balance out. Is your weight going down, body fat percentage decreasing, and muscle mass increasing? If all three of these go in the proper direction, over time, that’s what you want.
Looking at graphs each morning is a highly motivating tool.
The Reverse Graph
Please remember that most of these graphs are done in reverse. This means weight is better as it goes down, so the heavier weight is on the bottom side of the left axis. The lighter you get, the higher the graph goes. Same for body fat %, it should ideally go down. So this graph needs to be designed so that DECREASED body fat makes the line on the graph go up.
